Are you interested in learning about the top practices in DevOps and the significant advantages thereof? Dive into our article, where we unveil the finest continuous monitoring tools that have proven invaluable in our application management projects.
What is DevOps monitoring?
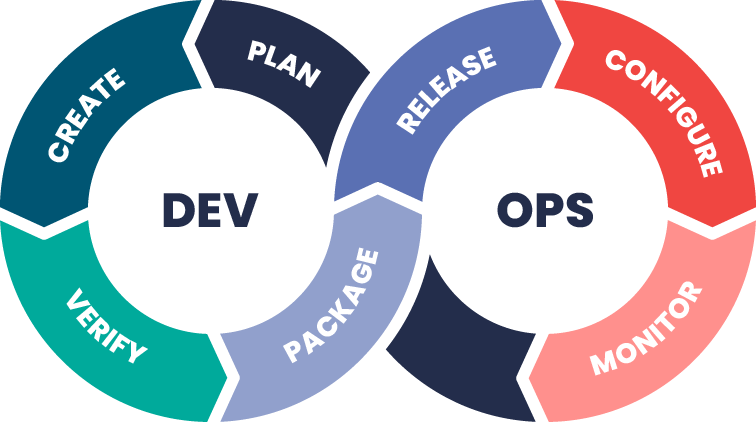
Embarking on the DevOps monitoring journey means taking charge of the entire development lifecycle – from the initial planning stages to development, integration, rigorous testing, deployment, and day-to-day operations. Picture this as having a panoramic, real-time view of how applications, services, and the entire infrastructure perform in the live production environment. It’s like being armed with powerful tools, including real-time streaming, historical replay – and visualizations are critical components of application and service monitoring. DevOps monitoring allows teams to respond quickly and automatically to any deterioration in customer service.

DevOps is not just about bringing development and operations teams together. While the collaboration between these teams is crucial, DevOps goes beyond mere tools and practices. It’s like adopting a whole new mindset that introduces fresh approaches to work, new principles, and innovative processes. Imagine it as a shift in perspective that transforms the traditional boundaries between development and operations. In exploring DevOps monitoring, we’ll unravel the key elements that make it more than just a set of practices – it’s a culture, a mindset, and a gateway to streamlined and innovative software development and operations.
What are the goals of DevOps monitoring – use cases
DevOps culture has forever changed the way we think about the software development cycle. Continuous delivery has translated into greater visibility, better performance tracking, and system availability. The most important of DevOps practices assume frequent changes, hence the need for real-time visibility into the state of the application with the help of dashboards and alert metrics. DevOps also relies on automation to speed up the entire process.
Continuous Integration/Continuous Deployment (CI/CD) pipelines
DevOps monitoring plays a critical role in CI/CD pipelines by providing real-time feedback on the health and performance of software builds and deployments. By tracking key metrics such as build success rates, deployment frequencies, and lead times for changes, teams can identify bottlenecks and inefficiencies in their pipelines, leading to faster and more reliable delivery of software updates.
Infrastructure health and performance monitoring
This use case focuses on the proactive monitoring of server and network health, resource utilization, and application performance. By setting up alerts for anomalies like high CPU usage, memory leaks, or slow response times, operations teams can quickly address issues before they affect users. This real-time visibility into the infrastructure layer helps maintain high availability and performance of services.
Application Performance Management (APM)
APM involves monitoring the performance and user experience of applications in real-time. This use case is crucial for identifying and diagnosing complex application issues, such as slow page loads or errors in code execution, which directly impact customer satisfaction. APM tools provide insights into the application stack, allowing developers to optimize code and improve overall application efficiency.
Security and Compliance Monitoring
In an era in which security breaches and compliance violations can have significant repercussions, DevOps monitoring extends to security posture and compliance status. This use case involves continuously scanning for vulnerabilities, monitoring for suspicious activity, and ensuring that security controls are effective. By integrating security monitoring into the DevOps process, organizations can adopt a proactive stance towards security, reducing the risk of breaches and ensuring compliance with regulatory standards.
File System Health and Integrity with ZFS Monitoring
ZFS, known for its robustness and advanced features for data protection, requires meticulous monitoring to ensure the health and integrity of file systems, especially in large-scale storage environments. Monitoring ZFS involves tracking the status of storage pools (zpools) to detect issues such as disk failures, degraded performance, or capacity problems. By implementing regular health checks on hard drives and zpools, administrators can proactively identify signs of hardware wear or data corruption. This includes monitoring for critical attributes like the S.M.A.R.T status of disks, the redundancy level of zpools, and the integrity of data through checksum verifications. ZFS’s native features, such as snapshots and replication, can also be monitored to ensure that backup and recovery processes are functioning correctly. Effective ZFS monitoring enables organizations to maintain data integrity, prevent data loss, and ensure high availability of storage resources, making it an essential practice in managing resilient storage infrastructures.
Application observability vs monitoring
When it comes to DevOps tools, you will often encounter these two terms. Observability and monitoring are often mentioned simultaneously in conversations about software development and IT operations (DevOps) strategies. But do observability and monitoring mean the same thing? They may seem like synonyms, yet there is a difference.
Monitoring
Monitoring means collecting individual data about a system and analyzing it to make further decisions based on the information from logs, traces and metrics. Monitoring does not provide a holistic view and broader context. For example – you can monitor a database or a specific microservice.
Observability
The concept of observability, in turn, is the ability to assess the state of a system based on the metrics and logs generated. You can say a system is observable when it provides you with relevant information – metrics, and logs that let you know what’s going on inside the application.
The easiest way to differentiate monitoring vs observability is to understand their purpose – monitoring alarms your software development team about the issues and anomalies within the software system, and observability helps understand the root cause of the issue. So instead of choosing between observability and monitoring, combine the two, as they work best when combined.
Leszek Jaros, Practice Leader at Inetum
Four Golden Metrics for Monitoring Systems
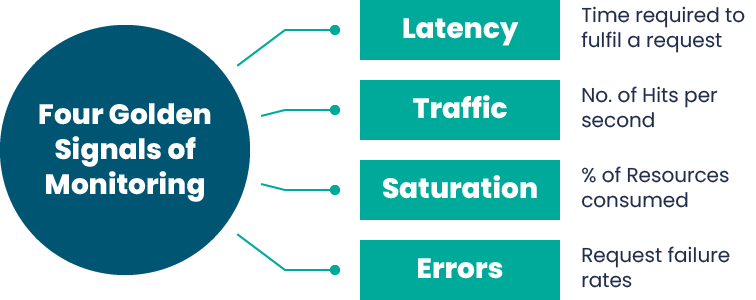
Modern distributed systems produce numerous metrics, encompassing infrastructure and host metrics like CPU utilization, APM metrics such as response times, and database metrics, among others. Constantly monitoring all these metrics is impractical, so we advocate for the judicious selection of a subset that acts as crucial application performance indicators when overseeing distributed systems.

Latency
Latency measures the time required for the system to respond to a request. High latency often indicates that the system is overloaded or there are other performance issues. Usually the delay is measured on the server side, but we can also measure it on the client side.
Traffic
Traffic is quantified by the volume of requests traversing the network. These requests may manifest as HTTP requests directed at a web server or API, or as messages dispatched to a processing queue.
By measuring traffic, traffic trends can be better monitored to discover capacity problems, misconfigurations, any forecasts, etc. Monitoring application traffic also helps you prepare for future demand.
Errors
The error rate defines the frequency of unsuccessful requests. Monitoring teams are tasked with monitoring both the comprehensive system error rate and the frequency of errors at individual service endpoints. These errors can signal misconfigurations in the infrastructure, system crashes, errors in application code, or disruptions in dependencies.
To assess the well-being of a service, it is essential to comprehend and classify errors into critical and non-critical categories. This not only facilitates a nuanced understanding of errors but also enables prompt action and implementation of corrective measures.
Saturation
Saturation determines the load on network and server resources. Each resource has a limit beyond which performance will degrade or become unavailable. This includes resources such as CPU usage, memory usage, disk capacity and operations per second. It takes an understanding of distributed system design and experience to know which parts of a service can be saturated first. Often these metrics are leading indicators so that performance can be adjusted before it drops.
 EXPERT KNOWLEDGE Software Development Life Cycle: DevOpsLearn about DevOps outsourcing services and how companies can benefit from them. Read the article |
Dedicated DevOps toolset for monitoring
- Prometheus, PagerDuty, Grafana, AlertManager
Prometheus is an open-source monitoring and alerting toolkit designed for reliability and scalability. PagerDuty is an incident management platform that orchestrates real-time responses to critical issues, integrating with monitoring tools like Prometheus. Grafana is a visualization and analytics platform commonly used with Prometheus to create interactive and customizable dashboards. AlertManager is an open-source component that handles alerts sent by Prometheus and manages their routing and notification to various channels. - ElasticStack
Also known as the ELK Stack, consists of Elasticsearch for distributed search and analytics, Logstash for data processing and enrichment, Filebeat for log shipping, and Kibana for data visualization and exploration. This integrated suite is widely used for centralized logging and monitoring, providing a comprehensive solution for collecting, analyzing, and visualizing log and event data in real-time. - Splunk
Splunk is a widely used tool that allows you to prevent critical issues thereby avoiding downtimes. Threat detection and AI-powered security and observability for any cloud-based solutions. - Datadog
Datadog as a tool aids in monitoring applications, services, databases, and servers. Datadog supports more than 80 integrations for customized systems. The tool also helps in the visualization of data related to upstream and downstream environments. - Nagios
It is an open-source monitoring tool, developed by a community of users. The system has several add-on products (agents) allowing you to flexibly extend the functionality of the monitoring tool. - Dynatrace
Dynatrace is a leader in this list and a leader in the Gartner Magic Quadrant 2023 Critical Capabilities for APM and Observability reports. The one-stop platform delivers end-to-end observability and application security, with dedicated modules for analytics, automation, Business Intelligence, and more.
Best practices in DevOps monitoring
- Define what you want to measure: begin by identifying the key performance indicators (KPIs) that matter most to your project and organizational goals. This focused approach ensures that monitoring efforts are aligned with business objectives, enabling teams to quickly identify and resolve issues that could impact performance or customer satisfaction.
- Don’t overcomplicate the dashboards: design dashboards to be intuitive and straightforward, providing immediate access to critical information without overwhelming users with data. Simplifying the presentation of metrics encourages regular use and engagement, making it easier for teams to respond to trends and anomalies in real-time.
- Remember for whom you are creating the dashboards: tailor dashboards to meet the needs of their primary users, whether they are developers, operations staff, or business leaders. Understanding the audience ensures that the dashboards present relevant information in a context that is meaningful and actionable for them, enhancing decision-making processes across the organization.
- Create a certain “observability” standard in the organization: Establishing a uniform approach to observability helps maintain consistency in how monitoring tools and practices are applied across different teams and projects. This standardization not only facilitates easier collaboration and knowledge sharing but also improves the overall effectiveness of monitoring strategies in detecting and addressing system issues.

APPLICATION MANAGEMENT SERVICES
Increase efficiency of your systems
Improve application performance, and reduce downtime with Inetum AMS! Get started now!
Importance of DevOps monitoring – summary
In the dynamic landscape of continuous integration and deployment, a DevOps approach emphasizes the extension of continuous monitoring across various environments, including staging, testing, and development. Rapid increase in frequent code changes, propelled by continuous integration and deployment practices, has elevated the complexity of production environments, especially with the integration of microservices and micro front-ends in modern cloud-native setups.
The importance of DevOps monitoring is underscored by the need for teams to swiftly detect and respond to any degradation in customer experience, emphasizing the criticality of timely interventions. Furthermore, DevOps fosters automated collaboration, breaking down silos between development, operations, and business functions within teams.
The article was prepared by:
Leszek Jaros, Practice Leader at Inetum
Amadeusz Kryze, DevOps Principal at Inetum
